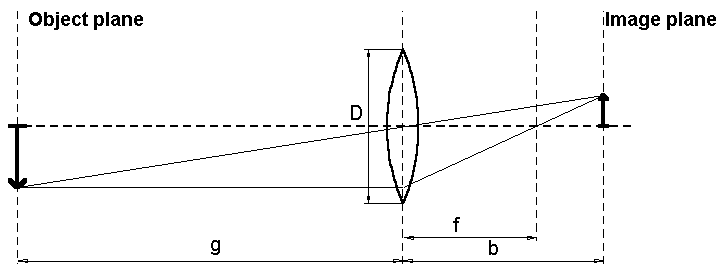
All image analysis is based on the highest possible image processing quality. In order to maintain a high standard, the user will find it beneficial to have some basic knowledge on the following areas:
The following chapters are an attempt to outline the terminology mostly met in practice in a concise and well-structured way. Extensive mathematical derivations and physical details are omitted on purpose. 1. Lumination technique 1.1 Luminous flux By the luminous flux Fv , we address the spectral radiation flux and the measure for the entire luminous capacity. The spectral flux
of the green illuminator (l = 555 nm)
with 1 W capacity equals a luminous flux of 683
lumen (lm). 1.2 Luminosity The Luminosity
Iv is the luminous flux per spatial angle sr (standard
globe: spatial angle = 4p [sr]) and is
given in Candela (cd). 1.3 Relation between Luminosity and luminous flux For a conical
reflector with a = half of the conic
angle, the entire luminous flux (=spectral capacity) is derived
from the Luminosity Iv as follows: 1.4 Illuminance The Illuminance
Ev is the illuminative flow per square area and is
given in lux (lx). 1.5 Luminous density The luminous
density Lv represents the luminous capacity Fv per area angle and per square
area element of a luminous or illuminated and reflecting area. It
equals the impression of lightness on an area and is given in Nit
(nt). 1.6 Lambert beams Lambert beams are totally undiffused and waste-free reflecting areas. If a Lambert beam is shone on with a illumination intensity of Ev, then the luminous density of the Lambert beam is:
In practice, dull surfaces come pretty close to the ideal Lambert beam, with reflection degrees varying considerably, dependent on the spectral characteristics (of colored areas). For a white piece of paper, the reflection degree is around 66% and can be used for orientation. 1.7 Luminous flow for lens representation In order to determine the necessary illumination intensity for camera photographs, the relation between luminous density of the surfaces and the resulting Illuminance on image level (sensor level) is important. The Illuminance on image level, in the following referred to as Evb, can be approximated fairly well from the illumination density Lv of objects to be photographed as follows:
Z = f/D is the filter number (= relation between focal length and objective opening) of the objective used. If the area to be
photographed is a Lambert beam, then the Illuminance
Evb on image level (=sensor level) can be approximated
by using the Illuminance Evb of the Lambert beam as
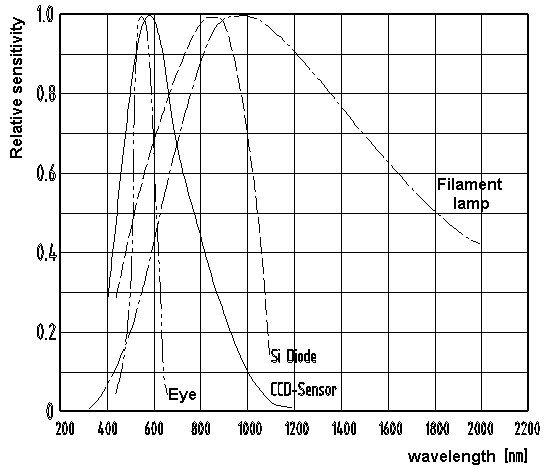
follows: 2. Lumen-technical characteristics of components 2.1 Spectral characteristics The following table
gives an overview of the spectral sensitivities of the human eye,
a typical CCD sensor, a Si photodiode, and an emission specter in
an electric bulb. As opposed to electric bulbs, LED´s have
a very small spectral bandwidth. Typically, their spectral
bandwidth lies around 50 nm. In order to adapt their relative
spectral sensitivity to that of the human eye, CCD cameras are
often equipped with IR lock filters to reduce the CCD sensor's IR
sensitivity.
Extremely high short distance IR sensitivity values of CCD sensors make CCD cameras a useful tool for illustration through IR-LEDs. Having a higher activity range then LEDs in the visible areas, they can realize photographic systems with suitable irritation suppression (in particular against fluorescent tubes) if coupled with lock filters in the visible area. 2.2 Light sensitivity of photodiodes A photodiode
generates a photographic flow proportionate to the illuminative
intensity independent of the illumination duration. 2.3 Luminous sensitivity of CCD sensors and cameras A CCD sensor is
based on the tension principle. The luminous stream generates
tension wish is read serially by the sensor and measured in
voltage. There is a proportional relation between the tension
intensity and the product of illumination intensity and
illumination duration. 3. Conversion rules for common measurements 1 J = 1 W
s 4. Video technique With the exception of high solution cameras and other kinds of special image providers (such as scanners or slow scan systems), image information is mostly transferred by cameras as video signals. In Germany, the norm for monochrome signals is CCIR 624 and PAL for colored signals. In other countries, the norms are, for instance, NTSC (USA) and SECAM (France, eastern European countries), all of which differ from the CCIR 624 norm in line number and temporal behavior, but not in their basic structure. In the following, we will treat the introduction of the CCIR 624 norm for image information coding as an example. The transfer of color images is based on that for monochrome signals. The necessary extensions are dealt with in section 4.2. 4.1 Monochrome video signal after CCIR 624 Electric specification Video signals are
transmitted as analog signals with a signal capacity of 1
VSS. The connection impedance for signal transmission
is set at 75 W. In industrial
settings, the connection is mostly realized by BNC linkages and
10 pole video connectors, whereas cinch connectors are common for
private consumers Image structure Video signal coding
has been determined along with the development of television
technique. In order to prevent flickering monitors as far as
possible, an image frequency of at least 50 Hz is required. Since
this image frequency results in signal frequencies that at the
time of television invention were hard to manage, the frame is
composed of two fields. One of them contains all information on
even image lines, the other that on uneven ones. The sub-frames
are transmitted alternatively with a frequency of 50 Hz, by which
technique flickering could be reduced tolerably, regardless of
the low frame frequency of 25 Hz. Images are scanned line by
line, beginning on the upper left corner and finishing at the
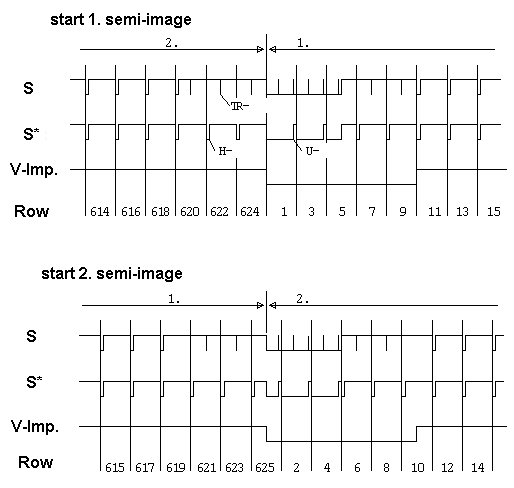
lower right corner. Image synchronization signals We will now discuss
the most important synchronization signals used in image
analysis.
· S:
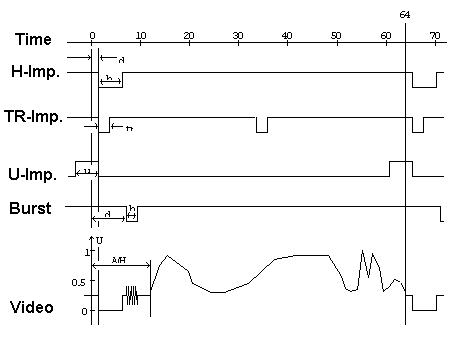
composite synchronization signal Line synchronization impulse Besides the H
impulse, several other impulses are important for decoding an
image line. In the table below, some essential impulses are
listed. The following values must be assigned to the individual
lines:
Each video image
line can be subdivided into two areas for synchronization and
image information. The synchronization information is transmitted
in the time interval of the horizontal scan break A(H). During
the remaining 52 µs the line gray-tones (or intensity and
color information in case of color images) is
transmitted. 4.2 Color transmission For color image coding, three basic signal types are mainly used in video technique. In the following section, we will introduce them and explain their specific characteristics. For the impulse terminology, the reader is referred to the overview on line synchronization impulses. RGB video signal This representation
is mostly used with monitors and 3 chip CCD cameras. Color
information is transmitted through separate video signals for the
red, green and blue light spectrum. They are structured like the
monochrome signal, with the synchronization information either
transmitted through separate signals or eclipsing the green
signal. YC video signal (SVHS signal) Using a YC signal means that the RGB information is transformed into a representation in the HSI coordinate sphere. The acronym is for hue, saturation and intensity of an image point. Intensity information is transmitted via the intensity signal Y (luminous signal), which equals the video signal in monochrome settings. The H and S information is coded by the chrome signal C through modulation of the color carrier with a carrier frequency of 4.43 MHz. This color carrier is amplitude modulated by its saturation. An additional phase modulation is carried out along with the coloring. For each line, a color burst signal with phase position 0° is generated as reference signal. Since the color information is modulated, it is limited to a bandwidth of 4.43 MHz, whereas the lumination information is transmitted without bandwidth limitations. PAL video signal Using a PAL video signal the Y and C signals are added up to a single signal. In order to enable subsequent division into component signals, the bandwidth of the Y signal must be restricted to under 4.43 MHz. Both chrominance and luminance information are bandwidth restricted, which means that this type of signal provides the poorest possible image quality. 4.3 Full-frame cameras There is one
disadvantage to interlaced photography with video cameras, that
is, the asynchronous illumination of both semi-images. If moving
objects are photographed, the result of this is a line
discrepancy in both semi-images of the object, which means that
only one of the two semi-images can be used for processing. In
other words, the utilizable solution is reduced by
half. 4.4 Camera operation modes Integration time The integration time equals the camera illumination time, during which the incoming light is integrated into the sensor. If the setting is less than the semi-image duration of 20 ms, then the illumination is carried out after each semi-image. During this time, the sensor is usually emptied on an electronic shutter, which enhances the removal of tension created by noise during execution. Even if a flash is used, it is advisable to adjust the electronic illumination time. Field integration operation This operation type
provides illumination of a semi-image during the processing of
the preceding semi-image, which is the most common operation type
for CCD cameras. It allows a maximum for illumination duration of
20 ms (50 Hz PAL signal).
Frame integration operation With this operation
mode additionally available for some cameras, the user can choose
longer illumination times stretching over two preceding
semi-images (40 ms). This results in higher light sensitivity.
However, a technically caused solution minimization must be
accepted.
An interesting issue connected with this operation type is the option of fully illuminating images with flashes, since the illumination intervals for two subsequent semi-images overlap. Thus, full images can also be taken with interlaced cameras. The disadvantage lies in the high alien-illumination sensitivity, because it overlaps with the flash while the illumination duration has to remain on 40 ms. Moreover, a long integration time also causes a higher signal noise than would be the case with a real full frame camera. In exceptional cases, however, this photographic technique can provide an economical alternative to still overpriced full frame cameras. Gain / AGC Gain adjustment is
responsible for the post-enhancement of video signals produced by
the CCD sensor. Even though a high post-enhancement can make a
dark image lighter, the quality of the image will inevitably
suffer from such a procedure, since the gain regulation does not
influence the illuminative sensitivity of the CCD sensor.
Consequently, a high enhancement heightens the noise in the video
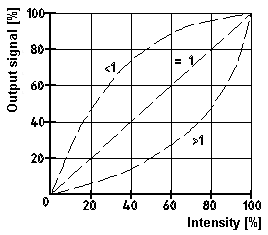
signal. g - correction Mit g-correction means an adjustable non-linearity of camera enhancement recognition lines. For a gamma value g = 1 , the resulting enhancement is linear. The recognition line patterns of all other values can be seen in the diagram below.
g- correction is applied for optimization of a utilizable image contrast through non-linear enhancement under various conditions. 5. Optics In this chapter, we
will introduce the basic objective computing rules. For reasons
of simplification, an objective will be regarded as an
individual, thin lens. We name:
5.1 Sharp edge requirement A sharp-edged
object representation is one that meets the following
requirement. For further considerations, we will assume that
these requirements are met. 5.2 Representation scale The representation
scale m, i.e. the relation between image dimension and object
dimension is computed as follows: 5.3 Aperture value The aperture value
Z, that is the measurement for object illumination intensity, is
defined as the focal length relative to the objective aperture
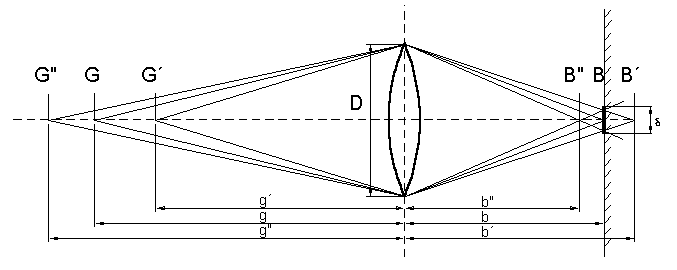
(double lens radius). 5.4 Depth of field The depth field
Dg is defined as the tolerance field
with the object width g in which the object is still represented
"sharp". In this context, "sharp" means that you cannot detect
blurred contours when regarding or processing the image. If the
object is point shaped and located in the object plane, then a
variation of the object width g renders the object as a more or
less big disc (blurred circle the double radius of which will be
called d) in the image plane. As soon
as the double radius of this disc is smaller than the image plane
solution (pixel distance of CCD cameras, film kernel in
photography), the representation is sharp.
When computing the
depth of field, we assume that g > f (realistic
representation).
By remodeling and application of the sharpness relation 1/f = 1/b + 1/g = 1/b´ + 1/g´ = 1/b" + 1/g" we get:
Solving the equation for g´ and g", we get the minimum and maximum distance for the representation of a point on an blurred circle <<FONT FACE="Symbol">d as:
Computing the difference to the object length g and using the relation Z = f / D, we can then deduce the depth sharpness:
The above formula
for Dg+ is only valid for
object lengths g < (f² / d Z).
For g >= (f² / d Z) the depth
sharpness Dg+ = ¥ and the given computation formula gets
invalid since the sharpness requirements introduced in section
5.1. have been used both for the deduction of g and
g".
For extremely low values of d and g << f² / d Z, the expression (dZg / f)² can be neglected, which makes it possible to approach the depth sharpness Dg as follows:
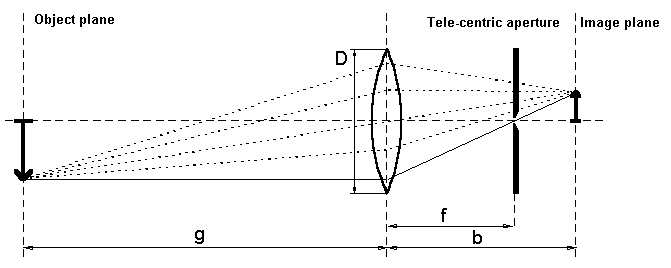
5.5 Telecentric lenses Especially for object measurement, the limited depth sharpness and interdependency between representation scale and object width (distance between object and objective) have an undesired effect. In order to suppress these errors, more and more users replace the aforementioned objectives with telecentric optical devices. They are structured as follows:
A small aperture
allowing only those rays to penetrate which run through the focal
point of the objective is inserted into the focal level of the
objective. Only those spectral rays running parallel to the
objective meet this requirement. If the object width g is
altered, neither the representation scale nor the object
sharpness of an ideal, point-shaped aperture are
affected. |
